SkyToll — Automated Central Monitoring

We consolidated 7 fragmented monitoring systems into a single platform with advanced automation — environment setup shortened from 1.5 days to 25 minutes, 7 dashboards replaced with one, and Jira tickets created automatically.
About the Project
For SkyToll, we designed and implemented a comprehensive automated central infrastructure-monitoring solution aimed at consolidating and automating oversight of client systems. The project involved migration from fragmented monitoring to a unified platform with advanced analytical and reporting capabilities.
Key technologies: Grafana, Zabbix, Jira, ELK Stack / New Relic, Terraform, Ansible, GitLab CI/CD.
Key Challenges
Current state (AS-IS)
- Separate Zabbix installations for each customer, with different OS versions, databases, and configurations.
- No unified dashboard across the different Zabbix installations.
- Primarily technical monitoring, without a service-level perspective.
- A manual process for creating Jira tickets.
- Employees monitoring 7 different Zabbix dashboards.
Implemented solution
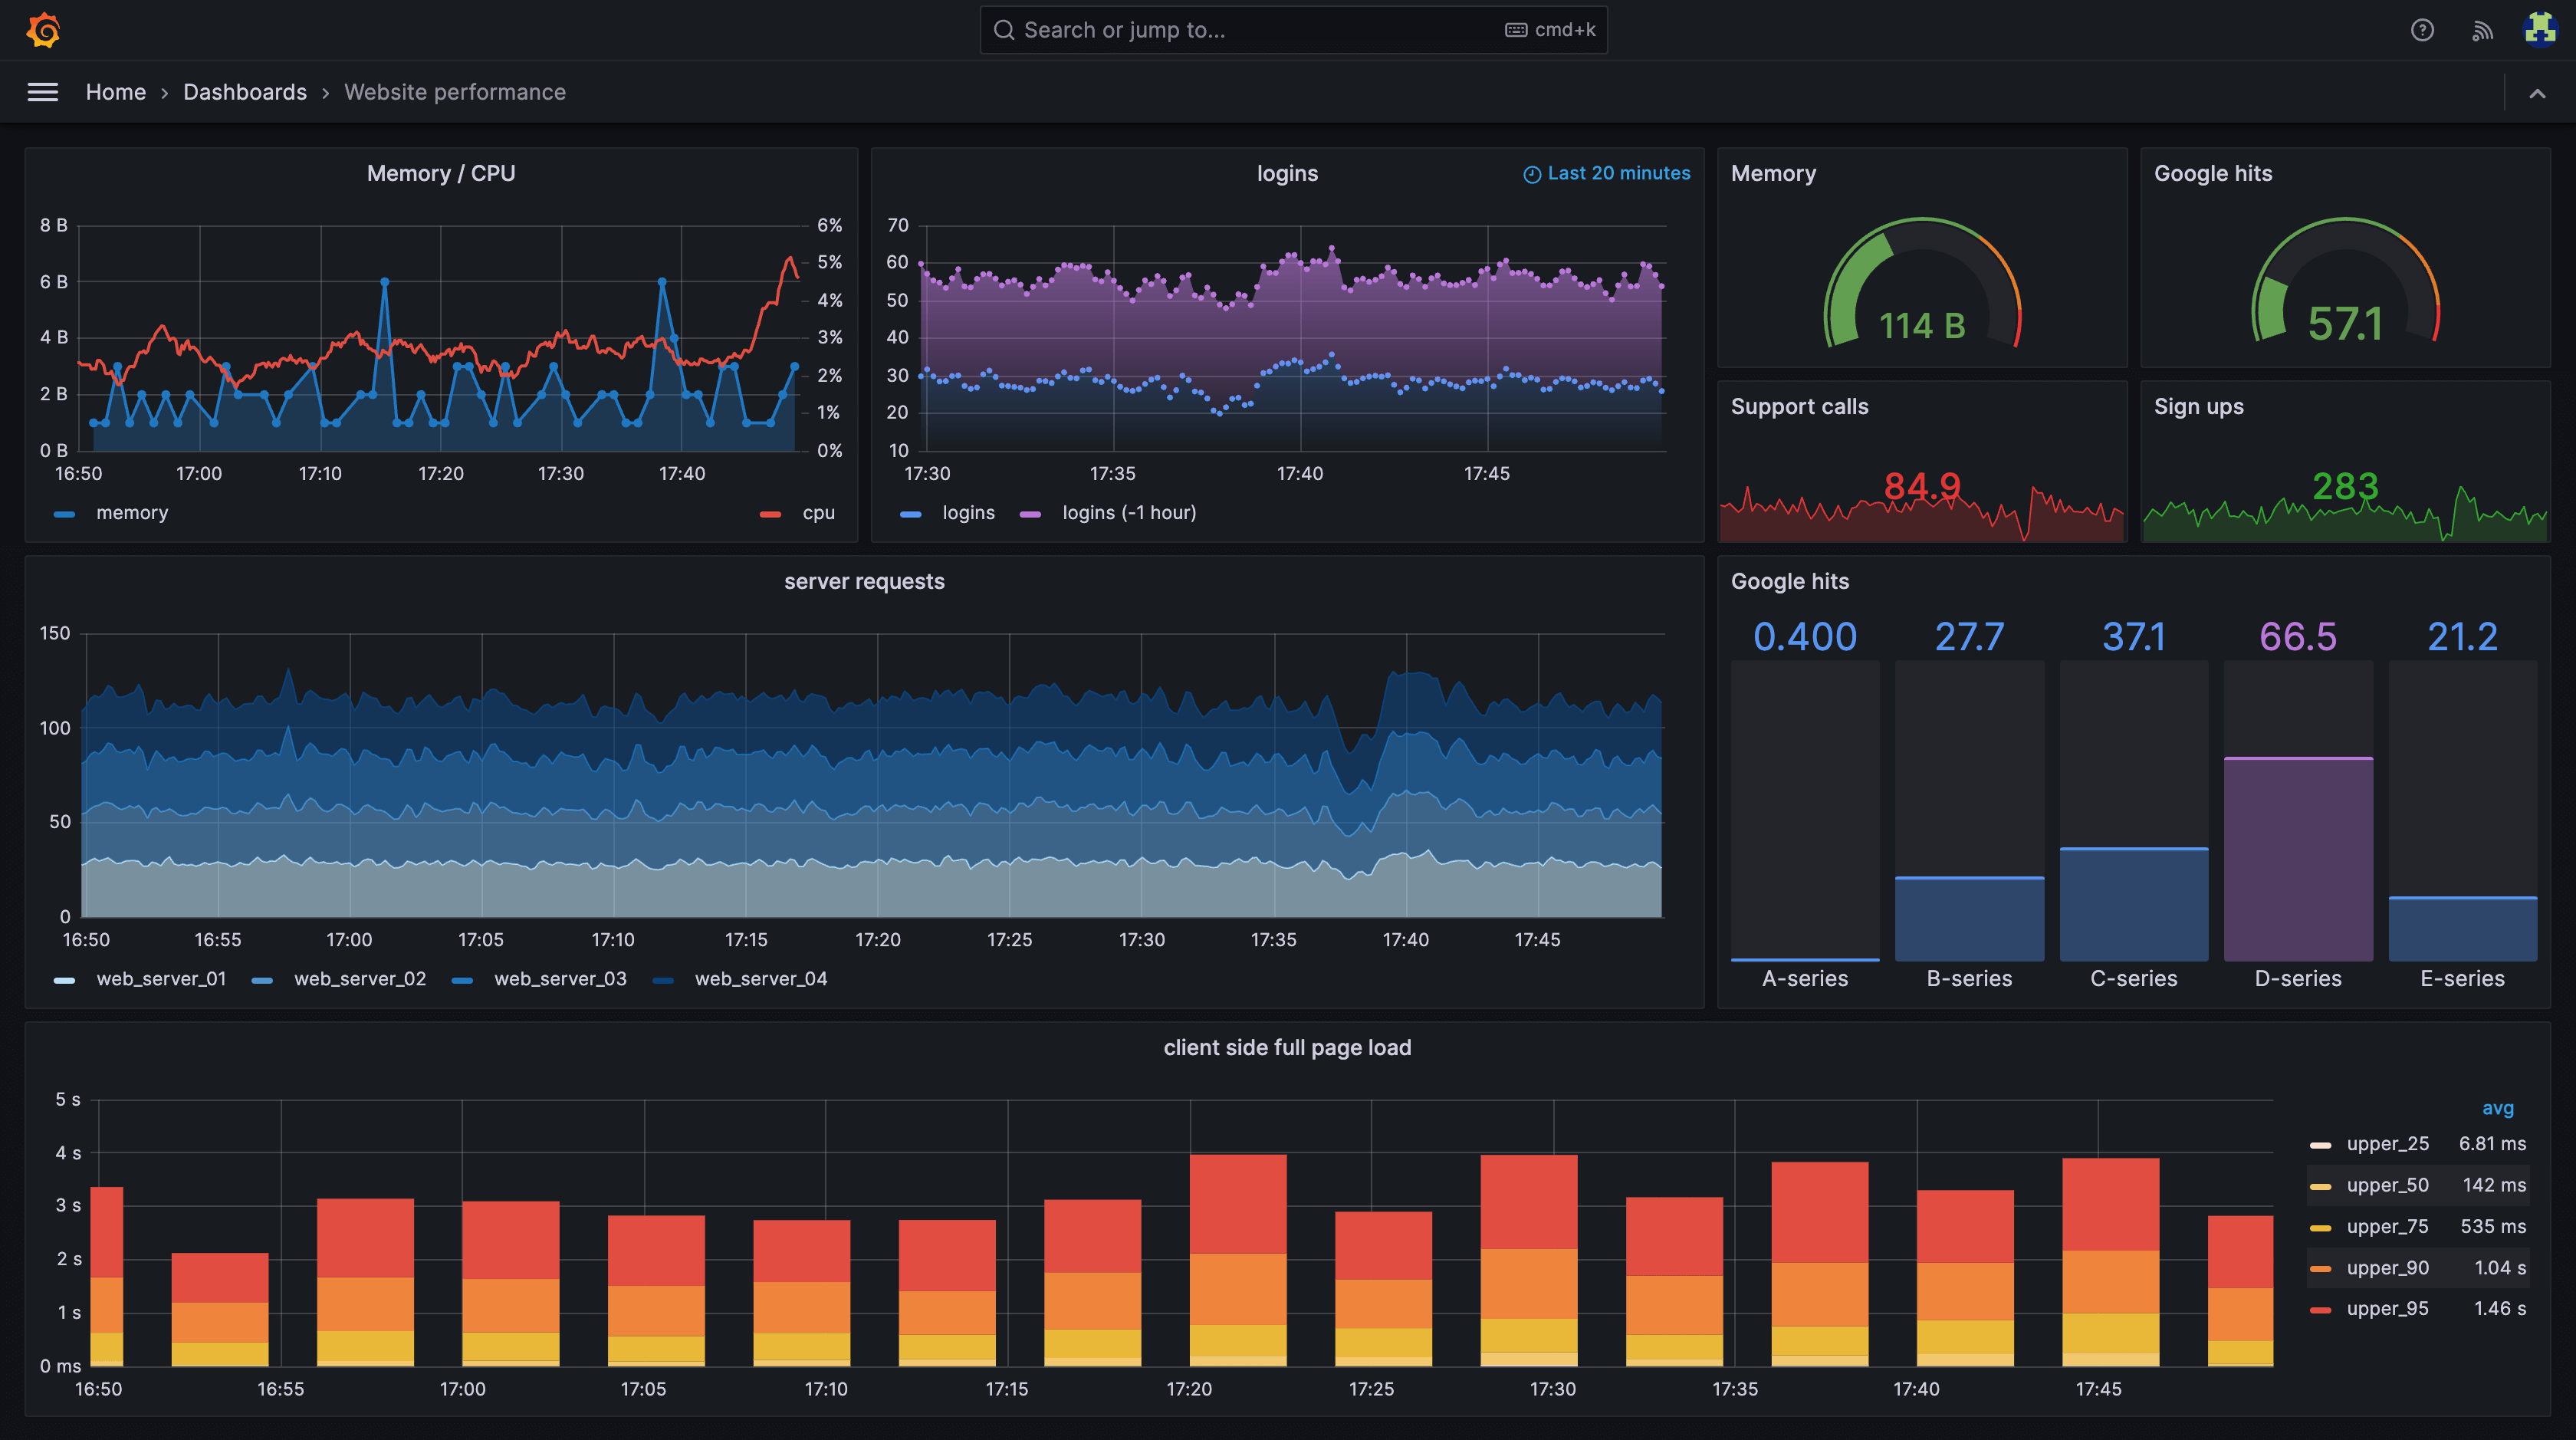
- Consolidated platform — an independently built monitoring platform with Grafana dashboards consolidating status from the local Zabbix installations.
- Client customization — Zabbix plugins tailored to the specific requirements of individual customers.
- Process automation — automated Jira ticket creation for detected issues.
- Extended monitoring — in addition to technical monitoring, service-level monitoring was implemented.
- Centralized management — consolidation of all Zabbix installations into one control center.
Technical Solution
Deployment and infrastructure
- Infrastructure as Code — deployment using Terraform, Ansible, and GitLab CI/CD.
- Configuration automation — Zabbix automatically configured using Git and Ansible.
- Scalability — the ability to rapidly deploy for any number of new clients.
98% time savings: complete installation shortened from 1–1.5 days to 25 minutes.
Integrations and tools
- Grafana — central dashboards and visualizations with automated deployment.
- Zabbix — advanced automation, noise reduction, and JMX monitoring with plugin customization.
- Jira integration — automatic incident creation and replication.
- ELK Stack / New Relic — service-level monitoring.
- API verification — ACK messages via an API interface.
- DevOps tooling — Terraform, Ansible, GitLab CI/CD.
Results and Benefits
Operational advantages
- Monitoring consolidation — one central dashboard instead of 7 different systems.
- Process automation — elimination of manual steps in incident creation.
- Dramatic deployment time reduction — new environment setup accelerated from 1–1.5 days to 25 minutes (98% time savings).
- Increased efficiency — faster identification and resolution of issues.
- Better visibility — a comprehensive view of all system states.
Technical benefits
- Unified platform — a standardized environment for all monitoring activities.
- Standardization — a strategy for upgrading and consolidating Zabbix versions (4.x → 5.x → 6.x → 6.4).
- High availability — production deployment with an HA architecture.
- Extended capabilities — advanced analytical and reporting functions.
Strategic Direction
The project represents the first step in a long-term monitoring-modernization strategy, with a planned gradual migration to the latest tool versions and expansion with advanced application-monitoring features. The solution ensures scalability for future growth and the integration of new technologies.
How We Work
Consolidating fragmented systems and automating the operational toil around them — that's the kind of platform work we deliver and run. Explore our services or read more of our case studies.