We run this ourselves. You can watch it break.
Grow2FIT operates a full reference implementation of the platform we design for clients — Kubernetes, GitOps, secrets and monitoring — on our own infrastructure. It runs every day, including the nights nobody is watching. And because the environment is ours, we can push a service into failure while you watch and let it recover: the one thing nobody can do on your production.
A running environment, not a lab we switch on for a meeting.
Every one deployed from Git and continuously reconciled against it.
Seven of them know what time it is and stay quiet during planned work.
The whole platform and its configuration. Nothing set up by hand.
A simulated bank day closes and reopens every night on its own.
The traffic in it is generated, not borrowed from a customer — which is exactly why we are allowed to break it. A demo runs against this environment live, not against a recording.
What it is made of
Three layers, one environment
The same three layers we design for clients, wired together the way we would wire them for you. What travels to your environment is the practice, not our pick.
Monitoring & observability
Grafana, Prometheus, Loki and OpenTelemetry collectors feeding one set of dashboards, an alert pipeline that ends in the channel the team already reads, and an AI investigation (HolmesGPT) that runs against the same data the moment an alert fires.
See it running →GitOps & deployment
Two repositories hold the platform and its configuration. ArgoCD reconciles them into the cluster, corrects anything changed by hand, and secrets arrive from OpenBao rather than living in the repository.
DevOps, CI/CD & GitOps →Kubernetes platform
An RKE2 cluster with hardened defaults, Traefik handling TLS and hostname routing, and cert-manager renewing certificates without anyone remembering to. The platform layer itself is declared in Git like everything else.
Kubernetes & Container Platforms →Scroll the diagram sideways to see all three bands →
Monitoring & observability
Six things this environment shows
Monitoring is the layer with the most to show, so it is the one documented here. Every screen below is from the running environment.
One window, from the business down to the infrastructure
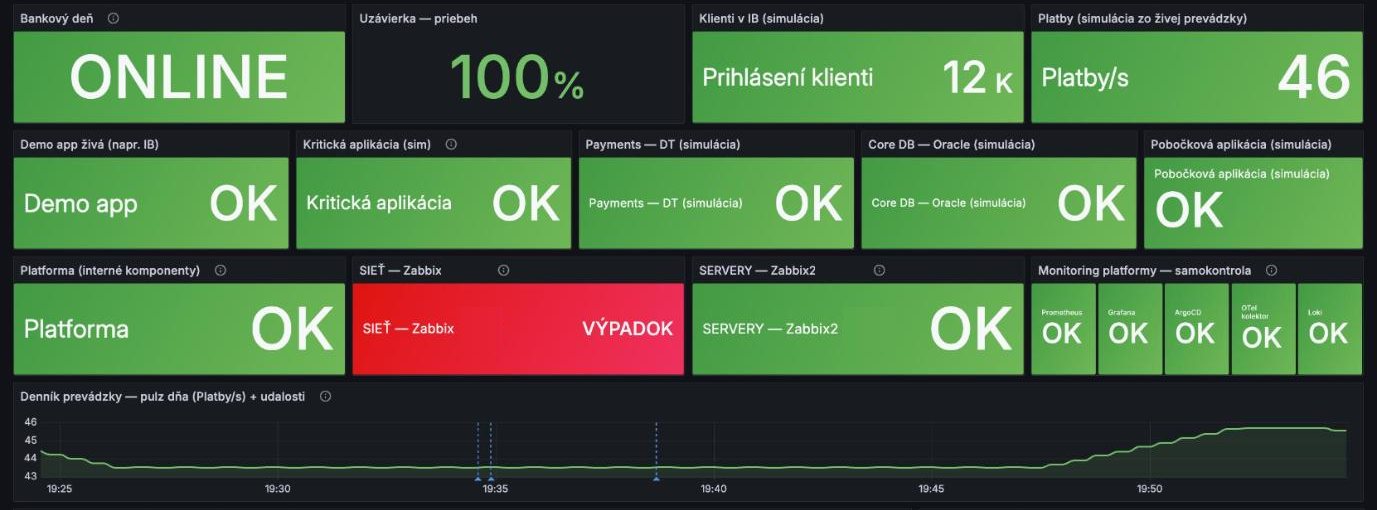
A manager and an operator open the same screen: the state of the business on top, the applications below it, the infrastructure under that, and the monitoring platform checking itself. No second tool holding a second version of the truth — which is where the argument in an incident call usually starts.
A tile has three states, not two
Green and red are the easy ones. The state that matters is the third: the service is up, it is answering, and it is slow. That is what your customer feels first — and it is decided by p95 latency and available replicas, not by eye, so two people reach the same conclusion.

An alert that doesn't say who owns it is just noise
Every rule carries a team label that decides the channel and the escalation behind it, and the routing table sits on the same screen. The alert also links to its runbook: one click from "something is red" to "here is what to do about it".

There are twenty-four of those runbooks, one per rule, all with the same five headings. This is the one behind the alert above, reproduced exactly as it sits in the repository.
Runbook: ImportantAppDown
Condition: 0 available replicas AND bank day ONLINE (conditional alert) · Source: Prometheus + bank-day gate
What's happening
The critical application (apps/important-app) has no available replica while the bank day is ONLINE — a business-impacting outage. The rule is gated: with the bank day OFFLINE the same condition stays silent by design.
Verify
- ArgoCD → application
important-app— is the Deployment scaled to 0 or failing? kubectl -n apps get deploy important-app— spec vs available replicas.- Blue "Zmena: important-app" annotation on the dashboards — was there a manual change or a sync right before the alert?
- Bank-day tile on Operator Overview — ONLINE means the gate is open and the alert is legitimate.
Act
- The app is deliberately managed by GitOps with manual sync: open ArgoCD → application
important-app→ Sync — this restoresreplicas: 1from Git and the pod starts within seconds. - Alternative (emergency only): ArgoCD → resource Deployment
important-app→ Edit →replicas: 1→ Save; reconcile with Git afterwards. - Do NOT delete the Deployment — metric expiration would delay alert recovery.
Escalate
App does not start after the sync (pod pending/crashing) → check events (kubectl -n apps describe deploy important-app) and escalate to the app team channel with the ArgoCD sync result.
After resolution
Tile "Kriticka aplikacia" back to OK, RESOLVED in the channel within ~3 minutes. The return is documented automatically — a blue "Deploy: important-app" annotation appears on the dashboards. Record the cause in the ops log.
Every chart carries the same log of what happened
Two kinds of mark land on the timeline: automatic ones — a deployment reconciled, the bank day switched over — and a note an operator types into the same channel the alerts arrive in. They belong to the moment rather than to one dashboard, so the same line appears on every chart with a time axis. The next morning, the tooltips are the shift handover.


A night is a shape, not a list of log lines
Batch processing and the database backup are drawn as bands in time. When throughput drops at one in the morning, it is visibly inside the backup window — the plan, not a fault. The deadline is on the same screen: the close finished at 04:58 against an 05:00 cut-off, and the two-minute margin is not in somebody's head.

The investigation arrives before you do
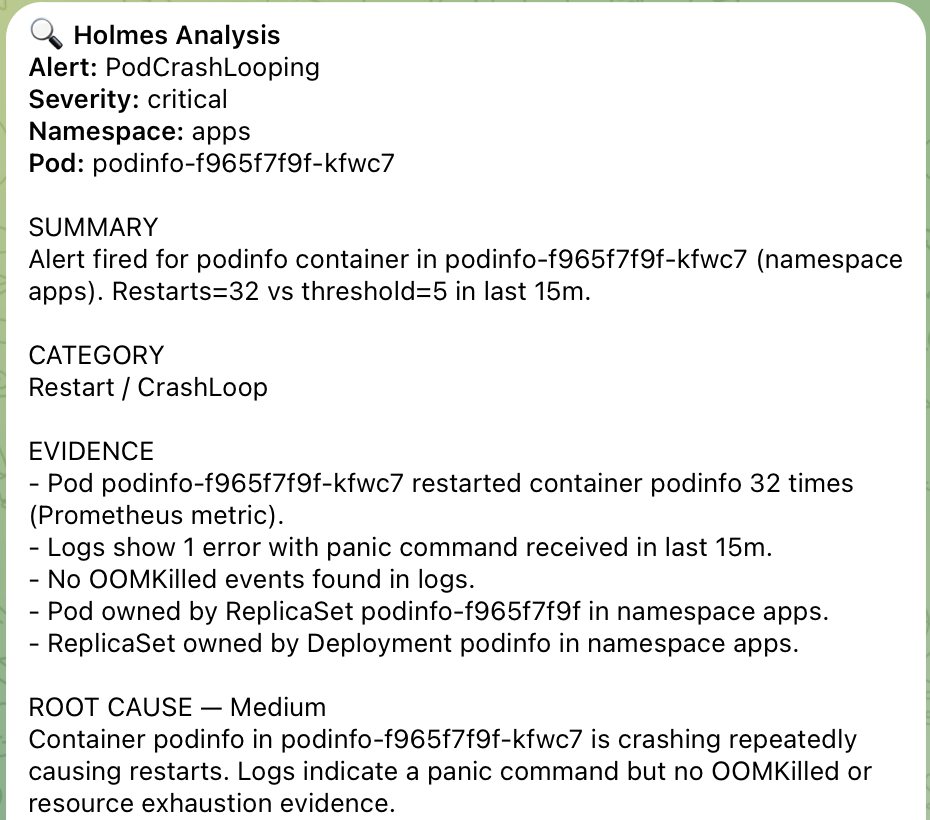
When an alert fires, an investigation runs against the same environment — logs, metrics, Kubernetes state — and lands in the same channel: evidence, a root cause with a confidence level, an explicit list of what it could not determine, and the commands to verify it. It is also allowed to disagree: in one run it marked one of our own alert rules as likely stale, and it was substantially right.
The fastest way to judge us is to watch our own environment fail.
A live demo runs against the environment above — the dashboards, an alert arriving, an AI investigation, and a service pushed into failure that recovers while you watch. About an hour. No slides.