Know something broke — before your customer tells you.
The worst way to learn your platform is down is a call from the business. We design, build, and run monitoring so your team sees it first — detection measured in minutes. And when something does break, an AI investigation is already running: you get the likely root cause and a suggested fix before you've even opened the dashboard.
Two numbers run through everything here.
How fast you know something is wrong.
How fast you fix it.
Every engagement starts by measuring them and ends by proving they improved. They're the thread through assessment, build, operations and training — and they turn technical reality into a number your business can act on.
Monitoring tells you that something broke. Observability tells you why.
MONITORING
Known thresholds, predefined dashboards
It answers the questions you already knew to ask: is the queue growing? is the service responding?
OBSERVABILITY
Correlated telemetry — metrics, logs, traces
Signals tied to a single request. It answers the question you didn't predict: given a failure you've never seen, can you reconstruct what happened, across which services, and what the customer impact was?
Under DORA, showing the system was available is no longer enough — a major ICT incident has to be detected, classified, explained and reported on a deadline. You can't report an incident you can't reconstruct. That's why observability has quietly become a regulatory requirement, not a nice-to-have.
From a raw signal to an answer — in three moves.
See
Collect metrics, logs and traces across your whole estate — infrastructure and applications.
Understand
Correlate the signals: root-cause analysis, context-rich dashboards. AI-assisted investigation means the moment an alert fires, it's already being investigated — so a signal becomes an answer, not a wall of noise.
Respond
Alerting, auto-ticketing, escalation rules.
What we deliver
Four ways to engage — applied to monitoring
The same lifecycle as everywhere at G2F — assessment, build, operations, training — focused on one question: do you find out about problems before the business does?
01
AssessMonitoring & Observability Assessment
Most teams run five to eight monitoring tools and still hear about outages from a user. We measure why.
- An independent audit of your tools, coverage and overlaps — a tool-sprawl map.
- A target monitoring & observability architecture and an MTTD/MTTR baseline.
- A prioritized roadmap. Fixed scope, vendor-neutral.
02
BuildFrom design to running monitoring
A green dashboard nobody trusts is worse than none. We build the alerting chain that actually fires — and the AI that investigates when it does.
- Deploy or consolidate the stack — Grafana, Prometheus, Loki, OpenTelemetry, Zabbix — or extend your existing tooling.
- HolmesGPT wired in — automatic root-cause analysis with a suggested fix.
- Hybrid observability, no rip-and-replace — plus monitoring→ticketing and a SIEM feed.
03
OperateMonitoring as a Service
Monitoring rots as infrastructure changes. Someone has to keep it honest — and answer when an alert fires at 2 a.m.
- Proactive monitoring and L2/L3 incident response, AI-assisted.
- Dashboards, alerts and templates kept current as you change.
- MTTD/MTTR trending against benchmarks; optional Control Centre.
04
TrainObservability Workshop
The goal isn't a 3 a.m. call to us. It's that your team reads the same signals we do.
- Observability fundamentals — metrics, logs, traces, OpenTelemetry.
- A hands-on workshop on Grafana + Prometheus + Loki, or your own stack.
- SRE practices and Monitoring-as-Code. Workshop and certificate.
When an alert fires, the investigation has already started.
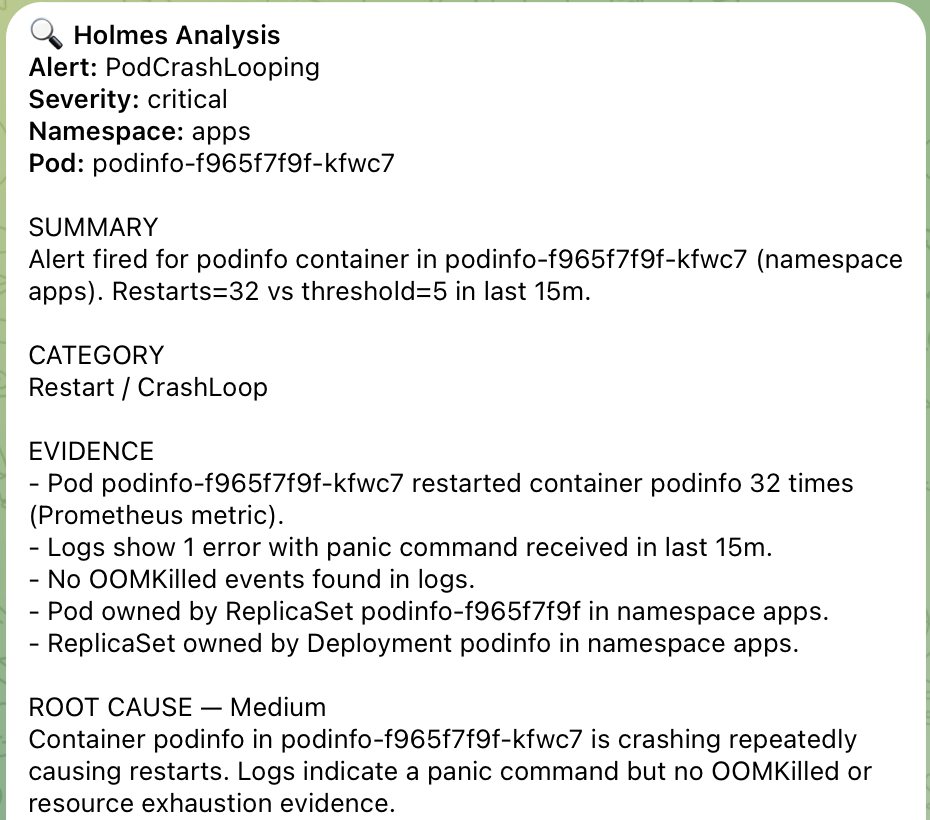
Our stack includes HolmesGPT — an AI agent that triggers the moment an alert does. It runs its own investigation across your telemetry, correlates the signals, and delivers a root-cause analysis with a suggested fix — automatically, straight to your team. Your on-call engineer opens the ticket and finds an answer waiting, not a blank dashboard.
Alert fires
From Prometheus, Zabbix or your existing tooling.
AI investigates
HolmesGPT correlates metrics, logs and traces and reconstructs what happened.
You get an answer
A root-cause analysis and a suggested fix, delivered to your channel and ticket.
This is where MTTR drops from war-room hours to minutes: not "something's wrong, go dig," but "here's what broke, here's why, here's what to do."
Vendor-neutral, built for regulated environments
We don't sell you a tool to replace the one you have — we assess what's there, consolidate the sprawl, and add what's missing. Our reference stack is Grafana, Prometheus, Loki, OpenTelemetry, Zabbix and HolmesGPT — and you can see it running, live. If your estate runs Dynatrace, Broadcom or ELK, the design follows your tooling, not our preferences. And for banks under DORA or the ECB: monitoring with an audit trail, versioned configuration, and change traceability the regulator will accept.
See our monitoring & observability stack running — live.
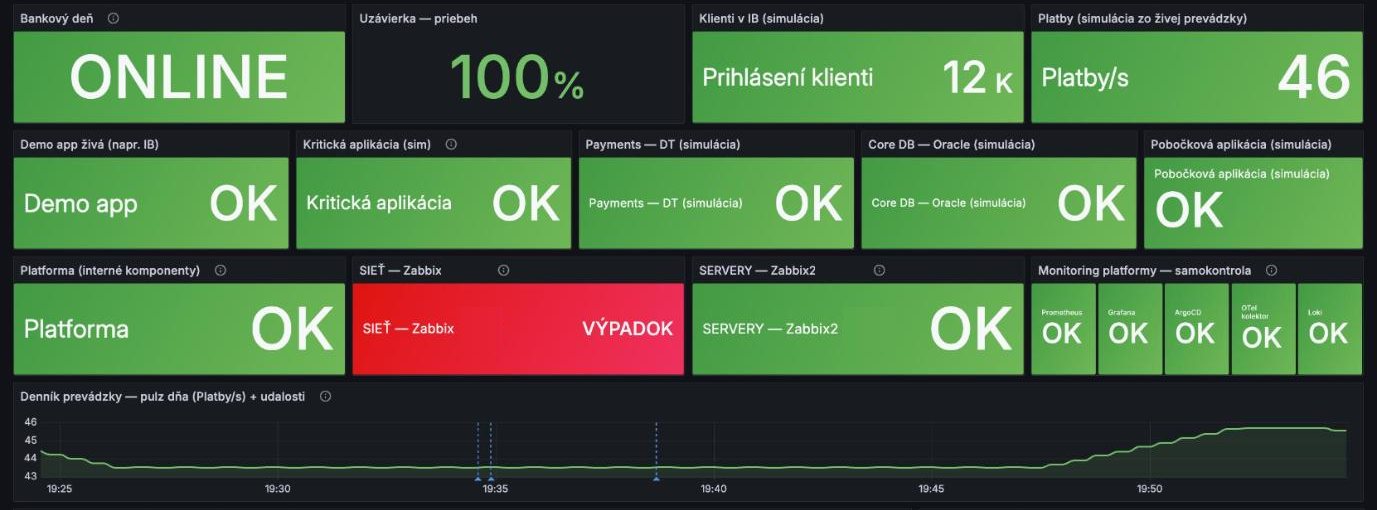
A real Grafana + Prometheus + Loki + HolmesGPT environment — dashboards, alerts, and an AI investigation you can watch happen.
- One window, from the business down to the infrastructure. A manager and an operator read the same screen — bank day, applications, infrastructure, and the monitoring platform checking itself. No second tool holding a second version of the truth.
- A tile has three states, not two. Green, slow, down. The middle one is what your customer feels first, and it is decided by p95 latency and available replicas rather than by eye.
- An alert that doesn't say who owns it is just noise. Every rule carries a team label that decides the channel and the escalation path, and the alert links to its runbook — one click from "something is red" to "here is what to do about it".
- An alert rule that knows the operating window stops waking people up. Seven of the thirty-five rules in our environment are aware of the night window; the traffic alerts that used to fire during the backup went quiet the day it went in.


Delivered in production
Where we've done this
Monitoring and observability we've assessed, built and run — for banks, regulated payment platforms and long-term operations.
Consolidation of 7 fragmented monitoring systems into one platform — setup cut from 1.5 days to 25 minutes, with automatic Jira ticketing.
Read the case study →
A full Grafana, Prometheus, Loki and OpenTelemetry stack on a dedicated Kubernetes cluster.
Read the case study → 🇨🇿
🇨🇿
Hybrid observability assessment — Broadcom, OpenTelemetry and Elastic, no rip-and-replace.
Read the case study →
🇸🇰
An assessment and target architecture for central monitoring and observability across a complex multi-site, multi-cloud banking environment.

An enterprise monitoring assessment — a Dynatrace review and Control Centre requirements (ServiceNow / SMS / Zabbix / Dynatrace).

SaaS monitoring — Zabbix dashboards for PostgreSQL, Puma, Sidekiq and Web (Flowis platform).
Read the case study →
Proactive Kubernetes monitoring and an ongoing operations partnership.
Read the case study →"Their team guided us through the analysis and design process, helping us transform those ideas into a robust, well-structured solution perfectly tailored to our needs. We see Grow2FIT as a reliable long-term partner bringing valuable experience and structure to our projects."
Marián BabušekCEO, KvaPay
Most teams find out about outages from a customer. That's the first thing we fix.
A Monitoring & Observability Assessment maps where you stand — tool sprawl, coverage gaps, your real MTTD and MTTR — and gives you a prioritized roadmap. Fixed scope, vendor-neutral. Most first conversations take 30 minutes. No pitch, no deck.