ILMAInventory · Lifecycle · Monitoring · Automation by Grow2FIT
One place for inventory, automation and monitoring across heterogeneous IT.
ILMA is an operations framework for banks and regulated companies. It solves what troubles IT operations there: a fragmented inventory, patching done by hand, and monitoring tool by tool with no single view. You get one inventory, automated infrastructure management and central monitoring, all over the same data.
What ILMA solves
Fragmented inventory
Servers are recorded in spreadsheets, in several CMDBs and in people’s heads. Nobody is sure what runs and who owns it.
One inventory
One consolidated record of servers, platforms and applications with their owners. It is checked against reality all the time, so unrecorded servers and drift show up on a dashboard.
Manual patching
Patching goes server by server, by hand. Nobody can say how many systems are compliant, or which ones run past end of life.
Automated infrastructure management, patching included
Patch groups and maintenance windows come from the inventory, playbooks do the work, a person approves. Compliance becomes a number you can show the regulator.
Monitoring tool by tool
Every team watches its own tool. Nobody sees the whole picture, and an incident call starts with an argument about whose data is right.
One central monitoring
One view over the monitoring tools you already have, from the state of the business down to the infrastructure.
Alerts without an owner
Alerts land in mailboxes and chat channels. Nobody knows who took one, and nobody can prove it afterwards.
A control room
Every alert carries an owner, a state and an audit trail: who took it, who escalated it and who resolved it. The duty roster is part of the same screen.
Slow diagnosis
The first hour of an incident goes on finding out what happened.
AI investigation
An investigation arrives together with the alert: evidence, a probable root cause and the commands to verify it.
Built for regulated IT with many owners
- Banks
- Insurers
- Utilities
- Telecom operators
- Public sector
- Manufacturers
The environment
- Legacy and new infrastructure side by side
- On-prem and cloud, often more than one provider
- Virtual servers and containers in the same estate
- Several teams and vendors, often a parent company in another country
- Regulation that wants data kept at home and evidence for the audit
Three modules
Each module is deployed on its own. Together they stand on the same data and make one whole.
Inventory and drift
- Inventory as code, with ownership, environments, criticality and patch groups
- Discovery of servers nobody recorded
- Drift report: the inventory against reality
- Audit trail of every change
Patching and upgrades
- Compliance in one number: critical CVEs, patched within the agreed days
- CVEs without a patch and systems at end of life
- Patch windows and SLAs, with playbooks driven by the inventory
- Link to ITSM and a report for the regulator (DORA)
Central monitoring
- One view over the tools you have: APM, infrastructure monitoring, Prometheus
- A control room for operators: the alert lifecycle with audit of who took it, escalated it and resolved it
- Duty roster and owner taken from the inventory
- Notifications you can answer, storm grouping and AI analysis of the alert
ILMA connects to the tools you already run (Vault, APM, Zabbix, ITSM) and does not replace them. It runs in your environment, on-prem or in the cloud, on Kubernetes: on your existing cluster, or we deliver the Kubernetes layer as well.
Your team does more with what it already has: automation and AI take over the routine, people handle what needs a decision.
How ILMA is delivered
Four steps, from a look at where you stand today to a team that runs it on its own.
Assessment
We look at where your IT operations stand today.
Deployment
ILMA goes into your environment, and we build the gaps you need closed.
Operations
We run it for you.
Handover
If you want to run it yourselves, your team takes it over.
See it running
We run a full implementation of ILMA on our own infrastructure, 24/7. A demo runs against it live, and because it is ours, we can break a service while you watch.
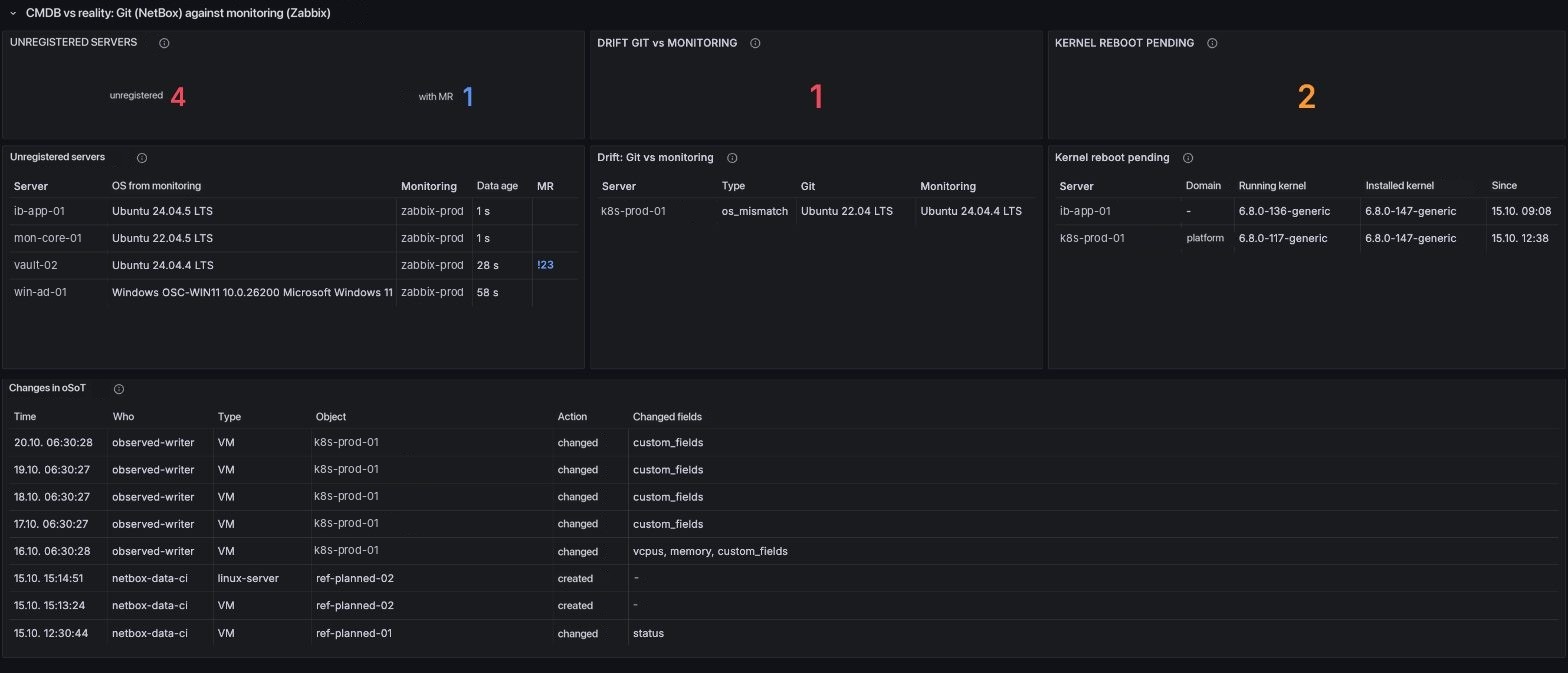
The inventory is checked against reality all the time
Monitoring reports what actually runs, and every difference lands on one dashboard. Nothing has to be looked for: what is missing from the inventory, what differs from it and what waits for a reboot is listed until someone resolves it.
 1234
- 1Unregistered serversRunning and reported by monitoring, but missing from the inventory.
- 2DriftReality differs from what is declared in Git. ILMA watches four kinds of drift; the one shown here is a different OS version.
- 3Reboot pendingA new kernel is installed, the old one still runs.
- 4Changes to the inventoryWho changed what, and when.
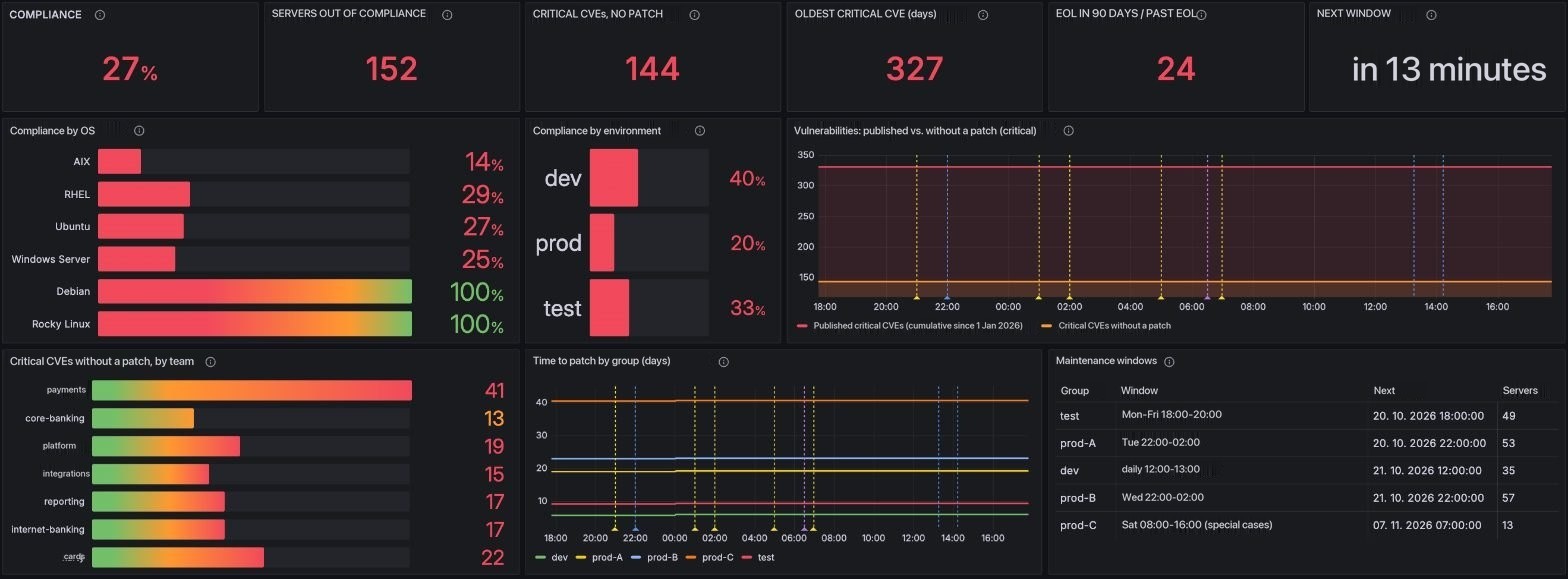
Patch compliance is one number, and you see what it is made of
A server is compliant when it has no critical CVE and was patched within the agreed number of days. Patch groups and maintenance windows are read from the inventory, so the dashboard and the automation work with the same servers and the same windows.
 12345
- 1The headline numbersCompliance, servers out of compliance, critical CVEs without a patch, end of life and the next window.
- 2Compliance by OS and environmentWhere the overall number comes from.
- 3Critical vulnerabilitiesPublished CVEs against those still without a patch.
- 4By team and patch groupOpen critical CVEs per team and time to patch per group.
- 5Maintenance windowsWhich group is patched when, and how many servers it covers.
One view, from the business down to the infrastructure
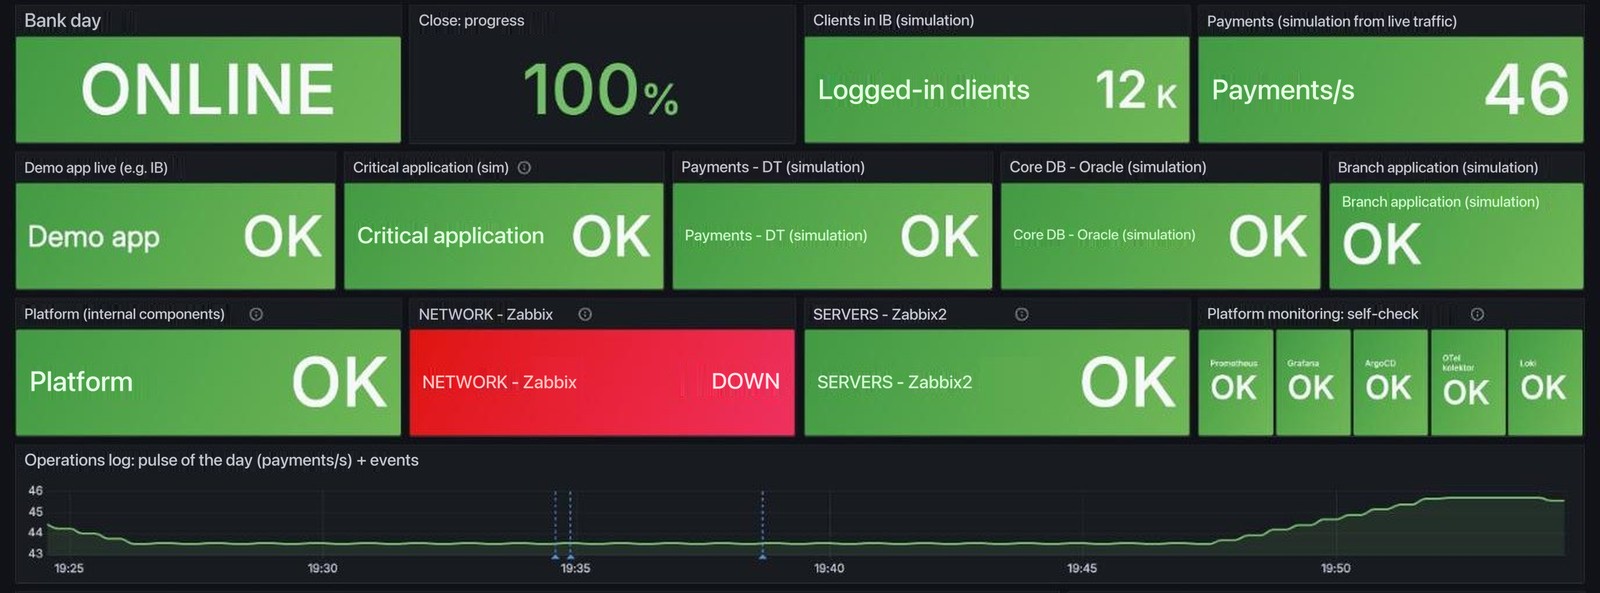
The state of the business sits on top, the applications below it, the infrastructure under that, and the monitoring checking itself. This is the overview for managers and teams; operators work in the control room, over the same data.
Every event becomes an annotation on all charts at once. Some are written by the system: a deployment, a change in the inventory, the bank day switching over. Others are added by an operator, who simply types a note into the team’s chat channel. The morning shift opens the dashboard and sees everything that happened during the night in one place.
 1234
- 1BusinessBank day, progress of the close, logged-in clients and payments per second.
- 2ApplicationsEach tile has three states: healthy, slow or down.
- 3InfrastructurePlatform, network, servers and the monitoring checking itself.
- 4Pulse of the dayThroughput over time. The dashed lines are annotations: what happened, and when.
The control room: every alert with an owner and an action
The operator sees what is open, what nobody has taken and whom to call, without clicking through. Each row carries the owner, the person on duty, the channel and the prescribed action, and the alert name links to its runbook.
 1234
- 1Open and untakenCritical alerts that are open, those nobody has taken, and for how long.
- 2Who is on duty todayTeam, person, phone and channel, read from the on-call schedule.
- 3Critical: call nowService, team, person on duty, action and state on one row.
- 4WarningsLower priority, with the action to open an incident.
Every alert has a state, and a person behind it
Three minutes after an alert, the person on duty is asked whether they have taken it. Each answer becomes a state on the timeline, recorded with a name and a time, so the next morning nobody has to reconstruct who did what.
Service: apps/important-app
Priority: P1 (critical)
Action: CALL
Call: person on duty for team app
The deployment has had no available replica for a minute. The bank day is ONLINE, so the outage has business impact.
Alert | Silence | Runbook

- New. The alert fired and nobody has been asked yet.
- Waiting. The question is out, no answer so far.
- Taken. Someone answered yes; their name is on the record.
- Snoozed. Remind me later, with the time of the reminder.
- Escalated. The answer was no, or nobody answered within five minutes.
- Planned work. The alert is muted for four hours.
The investigation arrives before you do
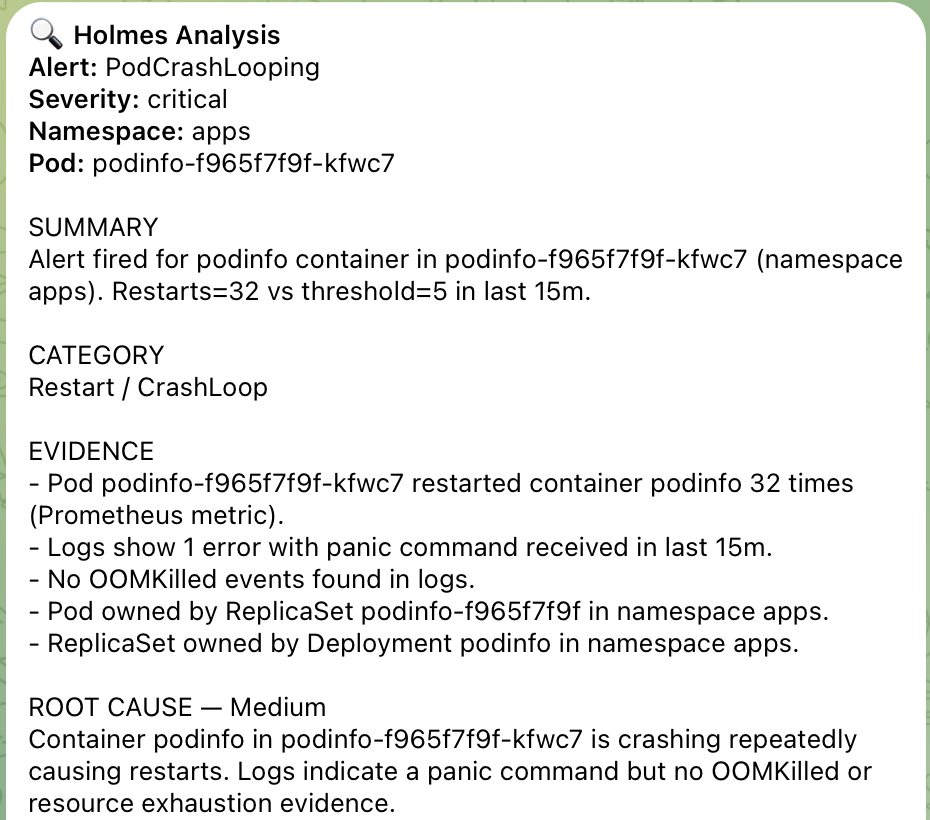
When an alert fires, an investigation runs against the same environment (logs, metrics, Kubernetes state) and lands in the same channel: evidence, a root cause with a confidence level, an explicit list of what it could not determine, and the commands to verify it.
Want to see ILMA running?
A live demo runs against our own environment: the inventory catching a server nobody recorded, patch compliance, an alert arriving with its AI analysis, and a service pushed into failure that recovers while you watch. About an hour. No slides.