ILMA · Module 3: Central monitoring
From alert to owner in minutes. With the cause already found.
Central monitoring shows the whole estate in one view, from the business down to the infrastructure. The operator handles every alert from a single screen, the control room: whom to call, what to do, and who took it over. The team that resolves it gets an AI analysis of the likely cause in its chat channel, before anyone opens a terminal. Every step is on record.
What it answers
The business, the applications and the infrastructure in one view, each with a clear state.
The owning team and the person on duty, with a phone number, taken from the inventory.
An AI analysis with the likely cause, the evidence and the commands to check it, sent to the team that resolves the alert.
Every incident of the last day, how it ended, and the notes operators wrote to it.
Every alert has a person who handles it.If nobody takes it over within five minutes, it escalates by itself. No alert waits in a mailbox until morning.
How an alert is handled
From the rule that fires to the record that stays. The machine routes and records, a person decides.
A rule fires
Rules live as code. Each one says which team owns the alert, how severe it is and what the operator should do.
It reaches the owner
The alert lands as a row in the control room and as a message in the owning team’s channel, with an AI analysis of the likely cause. Owner and person on duty come from the inventory.
A person calls
The operator reads the prescribed action and calls the person on duty. The name and phone are on the same row.
Take over, escalate, or planned work
One click, with a short note. Nobody reacts within five minutes, and the alert escalates to the team lead by itself.
The state comes back
When the rule stops firing, the alert ends with how it was handled: who took it, who recorded it, and when.
See it running
We run the module on our own infrastructure, 24/7. A demo runs against it live.
One view, from the business down to the infrastructure
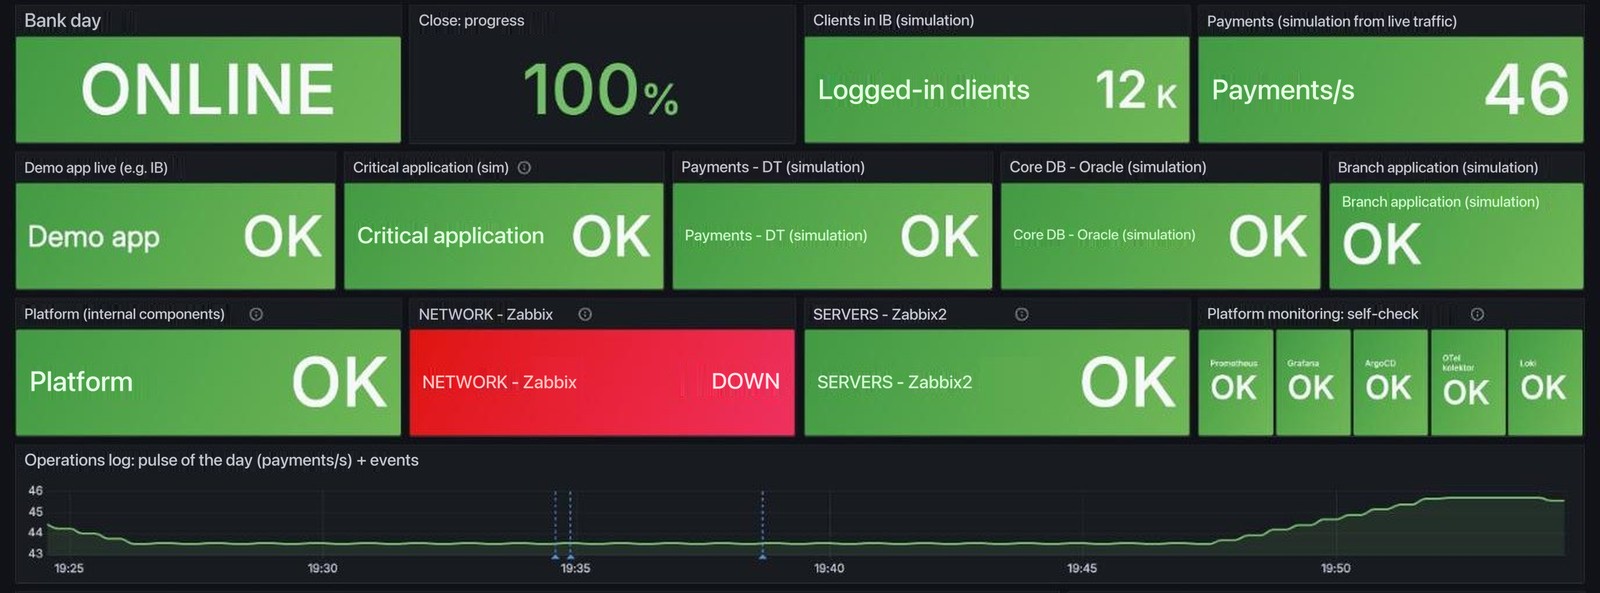
The state of the business sits on top, the applications below it, the infrastructure under that, and the monitoring checking itself. This is the view for managers and teams; operators work in the control room, over the same data.
Every event becomes an annotation on all charts at once: a deployment, a change in the inventory, a note an operator typed into the team chat. The morning shift sees the night in one place.
 1234
- 1BusinessBusiness day, progress of the close, logged-in clients and payments per second.
- 2ApplicationsEach tile has three states: healthy, slow or down.
- 3InfrastructurePlatform, network and servers, and the monitoring checking itself.
- 4Pulse of the dayThroughput over time. The dashed lines are annotations: what happened, and when.
Every alert with an owner and an action
The operator sees what is open, what nobody has taken over and whom to call, without clicking through. Each row carries the owner, the person on duty with a phone number and the prescribed action, and the alert name links to its runbook.
 1234
- 1Open and not taken overCritical alerts open now, those nobody has taken over, and how long the oldest has waited.
- 2Who is on duty todayTeam, person and phone for every team, without opening another tool.
- 3Critical: call nowService, owner, person on duty, prescribed action and state on one row.
- 4WarningsLower priority, the same columns, often with the action to open an incident.
Every alert has a state, and a person behind it
The alert is taken over, escalated or marked as planned work, in the control room or straight from the message, with a short note. Each answer becomes a state on the timeline, with a name and a time, so nobody has to reconstruct the night the next morning.
Service: apps/important-app
Priority: P1 (critical)
Action: CALL
Call: person on duty for team app
The deployment has had no available replica for a minute. The business day is ONLINE, so the outage has business impact.
Alert | Silence | Runbook

- New. The alert has arrived.
- Waiting. The team has been asked, nobody has taken it over yet.
- Taken over. Someone handles it; their name and the name of whoever recorded it are on the record.
- Snoozed. Remind me later, with the time of the reminder.
- Escalated. The operator escalated it, or nobody reacted within five minutes.
- Planned work. Known maintenance: muted for four hours, no escalation.
When the rule stops firing, the alert ends with how it was handled. Alerts resolved before anybody reacted show which rules are worth tuning.
The cause arrives with the alert
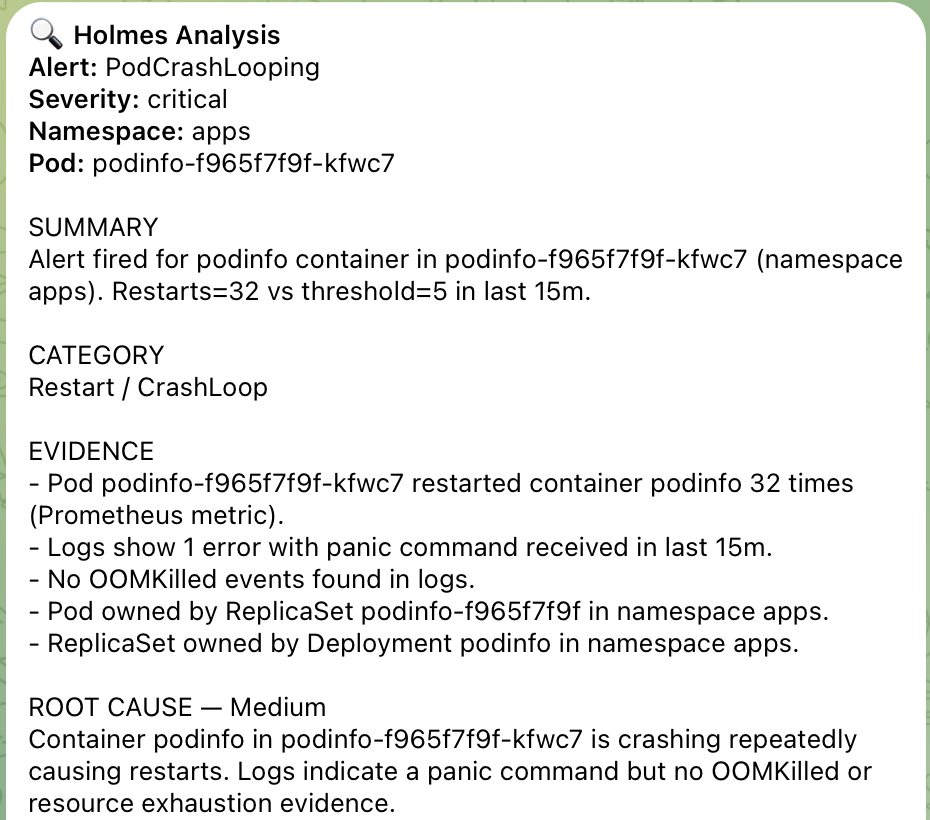
When an alert fires, an AI investigation runs against the same environment: logs, metrics and the state of the platform. The result lands in the chat channel of the team that resolves the alert, in the same structure every time, so the person on duty starts from evidence, not from zero.
- A one-line summary: what fired, where, and the value against the threshold
- The evidence that explains it
- A root cause with a confidence level, given only when there is evidence behind it
- Whether the alert is valid at all, and what it could not determine
- The commands to verify it, ending with the check that the alert cleared
The AI only reads. It changes nothing in the environment, and it is called only when an alert fires, with no continuous flow of data to the model.
One incident, not a flood
When many servers fail on the same rule for the same team at once, the control room treats it as one incident: one message, one decision, one analysis. Every affected server still has its own row, late members join the open incident, and the statistics count incidents, not hosts.
Where it connects
The module is deployed on its own or together with the rest of ILMA. It runs on top of the monitoring you already have, or on a monitoring stack we deliver with it.
APM, Zabbix, Prometheus
Metrics and logs stay where they are. Central monitoring reads them, and the rules on top are code in Git, changed with a review like any other change.
The whole monitoring stack
No consolidated monitoring yet? We deliver it with the module: metrics, logs and traces on open-source components (Prometheus, Loki, OpenTelemetry, Grafana), in your environment and as code in Git.
The ILMA inventory
Teams, people, phones and the owner of each service come from the operational source of truth. A new team member is one change there, and the duty roster follows.
Patching and upgrades
What is installed and running on each server feeds patch compliance. Both modules read the same monitoring and the same inventory.
See an alert go from firing to closed.
A live demo walks through the overview, the control room and one alert end to end: the message, the AI analysis, the take-over, the escalation and the record it leaves. About an hour. No slides.